By Africa Tech Radio
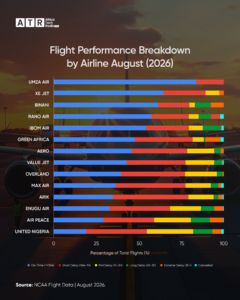
Flight reliability varies sharply among Nigerian airlines, with UMZA Air recording the strongest performance in the latest flight-disruption dataset, while United Nigeria ranks at the bottom after recording the highest overall disruption score.
According to official NCAA data for August 2026, nearly 60% of all domestic flights in Nigeria were delayed (4,765 out of 7,963 flights).
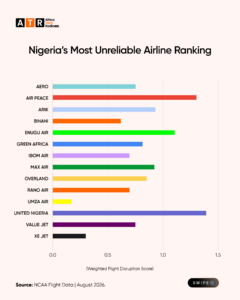
We have prepared an analysis and a ranking assessing these airlines using four measures: overall delay rate, long delays exceeding two hours, cancellation rate and a weighted disruption score designed to capture both the frequency and severity of operational disruptions.
UMZA Air leads the ranking
UMZA Air takes the top position after recording just 12.90% of flights delayed, with no flights delayed by more than two hours and no cancellations across 403 recorded flights.
Its weighted disruption score of 0.129 is the lowest among all airlines assessed, earning it a verdict of “Exceptional Reliability.”
XE Jet ranks second, despite having a considerably higher overall delay rate of 31.50%. Only 0.79% of its flights experienced delays exceeding two hours, and no cancellations were recorded. Its weighted disruption score was 0.37.
Binani, with only 57 recorded flights, ranks third. While its overall delay rate was 38.60%, its long-delay rate of 8.77% was considerably higher than XE Jet’s. Its relatively small flight volume means its result should be interpreted cautiously.
Larger airlines show a more mixed picture
The data becomes more revealing when the airlines with larger flight volumes are examined.
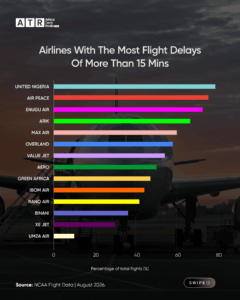
Rano Air recorded 503 flights and had a 42.94% overall delay rate, placing it fourth.
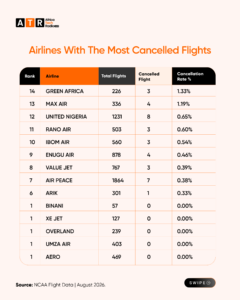
Ibom Air, with 560 flights, ranked fifth with a 45.36% delay rate. Its long-delay rate was relatively low at 3.75%, while cancellations accounted for 0.54% of flights.
Aero recorded 469 flights, with 52.45% experiencing delays. However, none of its recorded flights were cancelled, and only 3.20% experienced delays exceeding two hours.
At the middle of the table, Value Jet recorded the largest flight volume among the airlines ranked eighth or below, with 767 flights. Its overall delay rate was 56.71%, although its long-delay and cancellation rates remained comparatively low at 3.13% and 0.39%, respectively.
Severe delays become more prominent near the bottom
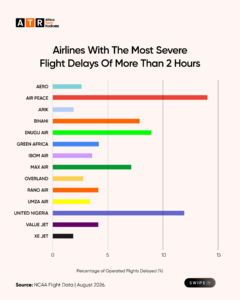
The rankings show that overall delay frequency is only part of the reliability story.
Max Air, for example, recorded a 60.71% overall delay rate, but 6.85% of its flights were delayed by more than two hours and 1.19% were cancelled.
The situation was more pronounced for Enugu Air, which recorded 878 flights, of which 66.29% were delayed. Nearly one in ten flights (9.79%) experienced delays exceeding two hours.
That combination pushed its weighted disruption score to 1.108, earning a verdict of “Severe Delays.”
Air Peace and United Nigeria record highest disruption scores
Two of the largest operators in the dataset recorded the weakest overall scores.
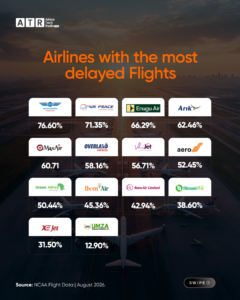
Air Peace, with 1,864 recorded flights, had a 71.35% overall delay rate. More than 14% of its flights experienced delays exceeding two hours, the highest long-delay rate in the dataset.
Despite recording a cancellation rate of just 0.38%, its weighted disruption score reached 1.288, placing it 13th.
United Nigeria, meanwhile, recorded 1,231 flights, with 76.60% experiencing delays—the highest overall delay rate in the table.
Its long-delay rate was also substantial at 12.75%, while cancellations affected 0.65% of flights.
With a weighted disruption score of 1.366, United Nigeria ranked 14th and received the verdict of “Worst Overall Reliability.”
The bigger picture
The data points to a significant reliability gap across the Nigerian aviation market.
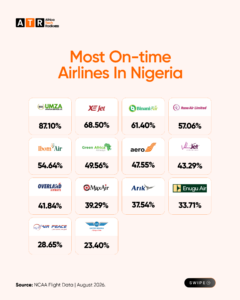
The difference between the top- and bottom-ranked airlines is substantial: UMZA Air’s overall delay rate was 12.90%, compared with 76.60% for United Nigeria.
That means the proportion of delayed flights at the bottom of the ranking was almost six times that of the top-ranked airline.
However, the ranking also highlights why passengers should look beyond the headline delay percentage.
Some airlines with relatively high overall delay rates recorded few severe delays or cancellations. Others combined frequent delays with a much higher incidence of disruptions lasting more than two hours.
For passengers, the distinction matters. A short delay and a three-hour delay may both count as “delayed” in a basic punctuality statistic, but they do not have the same impact on a traveller’s journey.
Reliability ranking
| Rank | Airline | Flights | Delay Rate | >2h Delay | Cancellation | Score |
| 1 | UMZA Air | 403 | 12.90% | 0.00% | 0.00% | 0.129 |
| 2 | XE Jet | 127 | 31.50% | 0.79% | 0.00% | 0.370 |
| 3 | Binani | 57 | 38.60% | 8.77% | 0.00% | 0.614 |
| 4 | Rano Air | 503 | 42.94% | 4.37% | 0.60% | 0.664 |
| 5 | Ibom Air | 560 | 45.36% | 3.75% | 0.54% | 0.668 |
| 6 | Aero | 469 | 52.45% | 3.20% | 0.00% | 0.706 |
| 7 | Green Africa | 226 | 50.44% | 3.98% | 1.33% | 0.770 |
| 8 | Value Jet | 767 | 56.71% | 3.13% | 0.39% | 0.782 |
| 9 | Overland | 239 | 58.16% | 2.93% | 0.00% | 0.833 |
| 10 | Arik | 301 | 62.46% | 2.66% | 0.33% | 0.864 |
| 11 | Max Air | 336 | 60.71% | 6.85% | 1.19% | 0.964 |
| 12 | Enugu Air | 878 | 66.29% | 9.79% | 0.46% | 1.108 |
| 13 | Air Peace | 1,864 | 71.35% | 14.16% | 0.38% | 1.288 |
| 14 | United Nigeria | 1,231 | 76.60% | 12.75% | 0.65% | 1.366 |
What the data does—and does not—tell us
The ranking measures operational reliability within the dataset, not the overall quality or safety of an airline.
A high disruption score does not, by itself, indicate an airline is unsafe. Similarly, a low score should not be interpreted as a guarantee that every flight will operate on time.
The results should also be read alongside flight volume. Airlines with very small numbers of recorded flights, such as Binani and XE Jet, have less statistical weight than airlines with hundreds or thousands of observations.
The clearest finding, however, is the scale of the punctuality gap: reliability differs dramatically across the airlines assessed, and the frequency of delays alone does not tell the whole story.